Foraging has become an increasingly popular past time, the ability to find food in the wild could assist with survival but also offers an immense sense of achievement and satisfaction. It is important that the practice is carried out with care and attention to ensure that potential food sources are correctly identified. Edible mushrooms are a great source of nutrition, however, there are some that are poisonous that could make you sick or in the worst-case scenario lead to death.
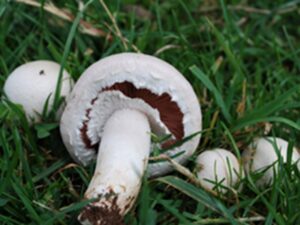
Figure 1 – The field mushroom, Agaricus campestris
There are three main groups of mushrooms that foragers will look for, these are the parasites, which parasitise trees, plants and even insects, the saprobic mushrooms, which rot down old wood or other dead substrate, and the mycorrhizal fungi which attach themselves to the roots of host organisms transferring nutrients, among other things between themselves and the host. All interact heavily with their environments and as is the case with living organisms, the environment in which they develop and grow will have a direct influence on their exposome which by definition encompasses life-course environmental exposures.
For this study, we have focussed on one specific species of saprobic mushroom that commonly grows in grassland. The Field Mushroom, Agaricus campestris is probably the most commonly collected edible mushroom in the UK. It is also one that is commonly found on roadside verges, and is also regularly mentioned as a mushroom that can absorb pollutants from its environment. It’s genus has many edible members that grow in the same environment and it is likely that the results from this experiment would be reflected by those species. The sampling was completed by Marlow Renton from Wild Food UK who is an expert forager and recently published a Foraging pocket guide.
It is proposed that a fruiting body of a mushroom that developed and grew in a polluted environment would absorb some of that pollution and become polluted. Fruiting bodies that develop in a clean pollution free environment should reflect that in their respective exposomes.
When foraging close to urban areas there may well be times that foragable items are spotted close to a busy road. These fruits may appear to be clean or pollution free but it is difficult to make that assessment using just eyes alone. The following case study aims to investigate the influence of pollution on the fruiting bodies of mushrooms as a function of distance picked from a busy road. Roads by their very nature are a serious source of pollution, the vehicles that use them exhaust a mixture of gases including water and carbon dioxide, mixed in with the major combustion products are other more toxic gases and also some metal particulates from the wear and tear of the engine. Modern vehicles are equipped with catalytic converters that serve to chemically convert many toxic emissions into a more inert and less harmful gases. It is hypothesised that concentrations of the catalysts used in the catalytic converters may well be higher in the soil and/or mushrooms found closer to the road.
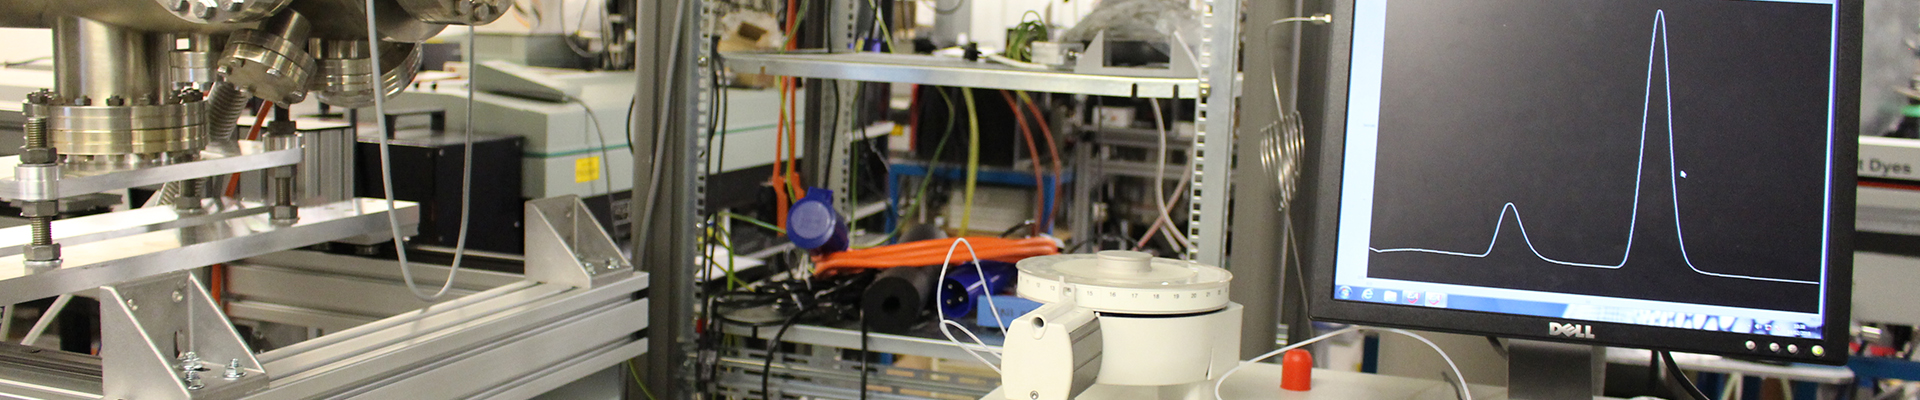
Inductively Coupled Plasma Mass spectrometry (ICP-MS) is a sensitive analytical technique used to measure ultra-trace levels of metals present within a sample. Samples must be water soluble. Solid samples may be analysed by ICP-MS following on from sample preparation that usually involved acid microwave digestion. Once in solution the samples are sprayed into an argon plasma which could be up to 10,000 ºC, the water will evaporate and the high energy of the plasma will cause any metals present in solution to ionise which are charged versions of the atoms. The mass spectrometer will then separate the different masses of the ions and record their abundance which is proportional to their concentration within the sample.
Aims and Motivation
In order to assess the uptake of various metallic toxins, a simple experiment was conducted to test the hypothesis that mushrooms picked closer to the road contained a higher level of toxicity than those picked further away from the road. The influence of the substrate on the mushrooms would also require careful consideration by analysing soil substrate samples collected from the same sampling locations as the mushrooms.
Methods
Mushroom samples were picked along with soil samples from the same spot at various intervals moving away from a busy road in Hereford. The collected samples were stored in sterile containers and transported to the Artemis Analytical laboratory for analysis. Once received the samples were dried in a drying oven for 24 hours at a temperature of 80 ºC. The samples were ground up in a pestle and mortar, ~0.1 g samples from each was weighed accurately, the same sample preparation was used for the mushroom and soil samples. A supermarket-bought field mushroom was also prepared in the same way and analysed as a point of reference.
The powdered samples were each digested with 10 mL of concentrated nitric acid in a microwave digester on full power for 2 hours until the solids had fully dissolved and everything was in solution. The acid digestate was made up to 100 mL, filtered and then analysed using ICP-MS.
The ICP-MS instrument was setup and calibrated using external standards, a broad suite of elements was measured including the precious metals found in catalytic converters.
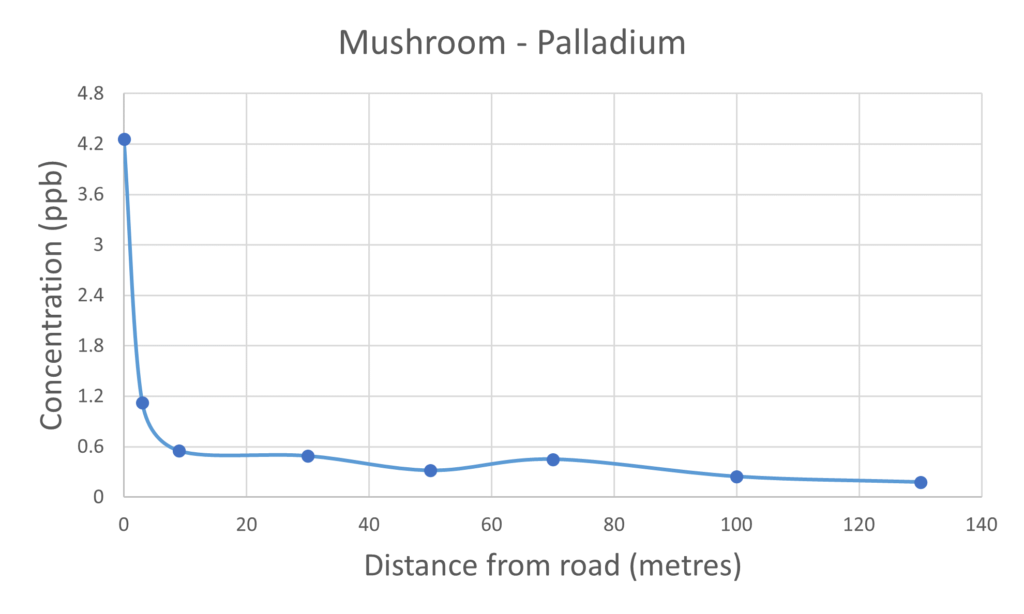
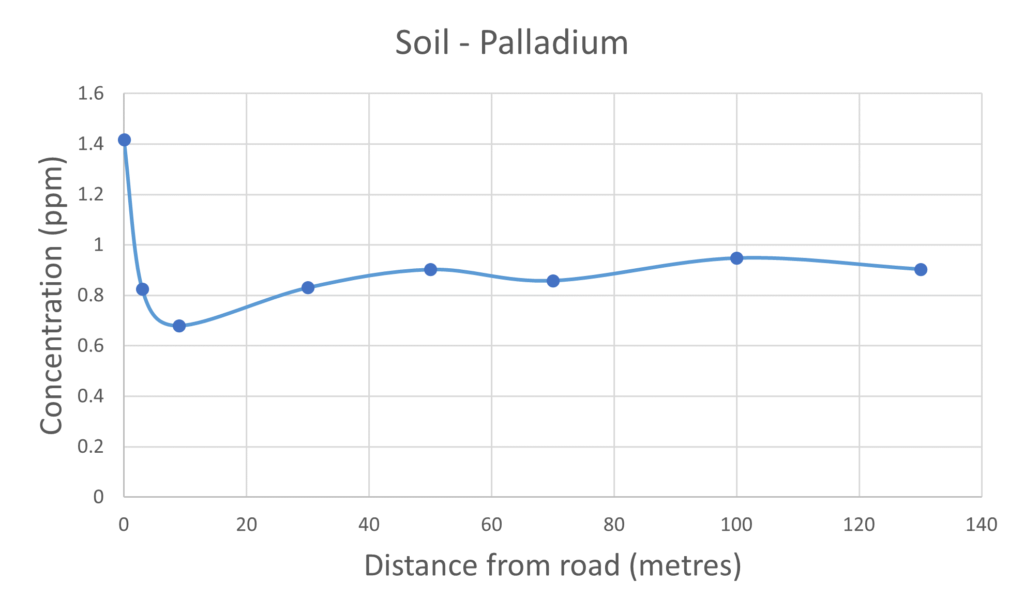
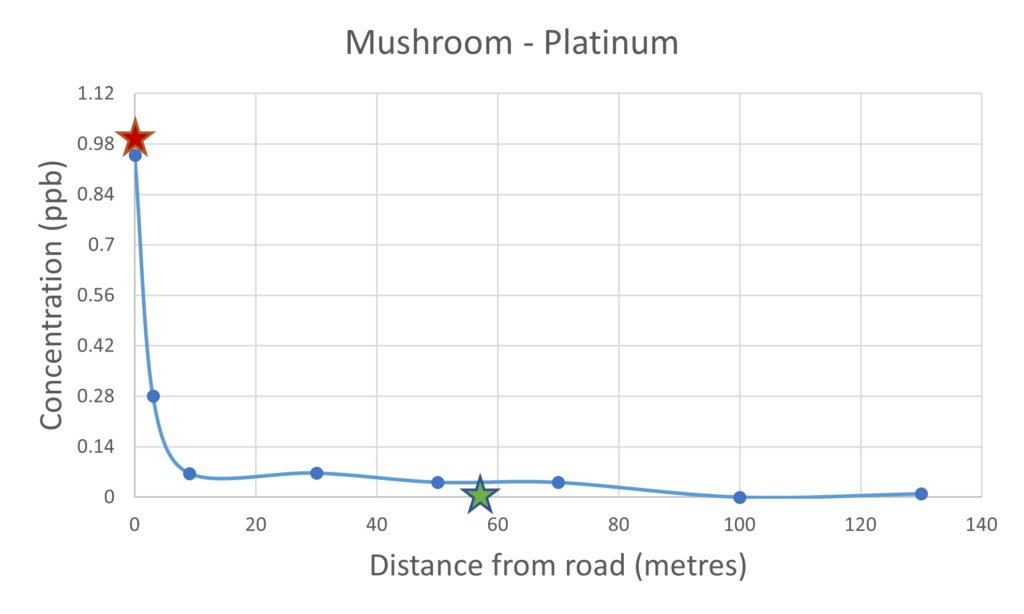
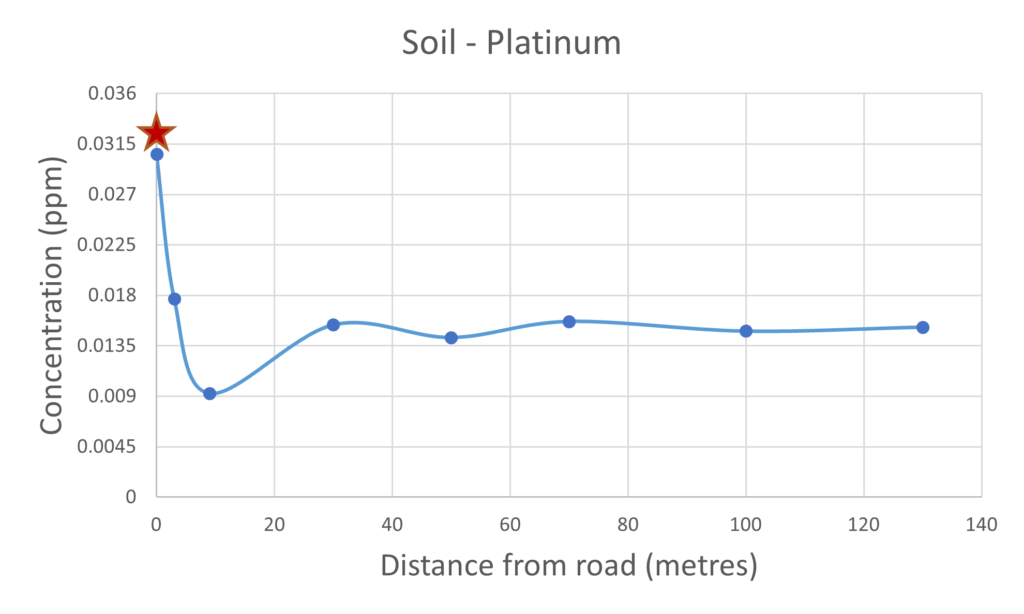
The concentrations of the metals are expressed in parts-per-million (ppm) for the dry soil samples. The concentration in the mushroom samples is expressed in parts-per-billion (ppb) and has been calculated for hydrated mushrooms assuming that the 99.18% of a mushroom is water.
Limitations 1. It is worth noting that these tests are by no means exhaustive, only the metallic elements were screened and measured. The vitamin content and nutritional value was not assessed in this study. This is possible using a different type of mass spectrometry, it would make an interesting future study.
2. It was impossible to separate the grass roots and other organic matter from the soil samples. Therefore, where we refer to soil it is really the soil and growing substrate.
3. Samples were taken from as regular intervals as possible from the road, though as they were growing naturally precision was impossible.
4. Only 1 species of edible mushroom was used for the test, this can be assumed to be reflected by other members of the genus, but these results do not apply to all fungi, edible or otherwise.
5. Other variable natural factors that may influence these results such as wind direction have to be assumed to be homogeneous in these results.
6. Assumptions have to be made about whether the source of the pollution was the growing substrate or airborne particles as the process itself was not observed, though the data collected informs those assumptions with reasonable veracity.
Results and Discussion
The results presented below for the soil and mushrooms sampled at 0 metre distance from the road samples were collected from the centre of Hereford right next to an extremely busy A road, these data are marked with the red star on the plots below. The other samples were collected at locations of increasing distance from a road in a more rural locality close to Hereford. The green star data point is from the supermarket-bought mushroom and is included as a point of reference.
For the vast majority of the elements measured in both the mushroom and soil samples it was found that their respective concentrations were higher in the samples collected closer to the road than those collected further away. The palladium and platinum results presented in figures 2 and 3 respectively clearly demonstrate the inverse relationship between collection distance from the road and concentration.
Figure 2 – Palladium measured in mushrooms & soil
Figure 3 – Platinum present in mushrooms & soil
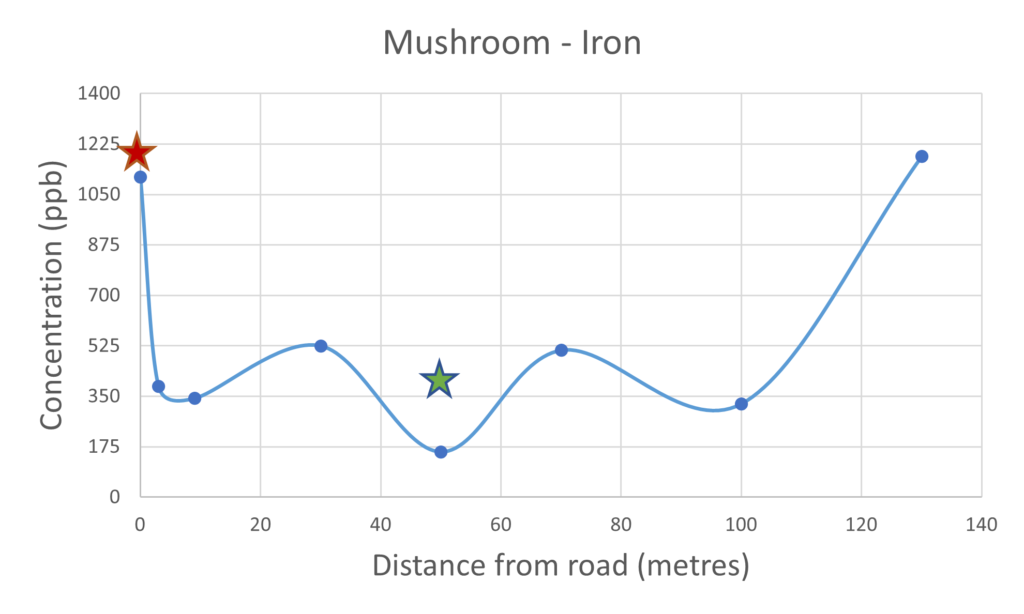
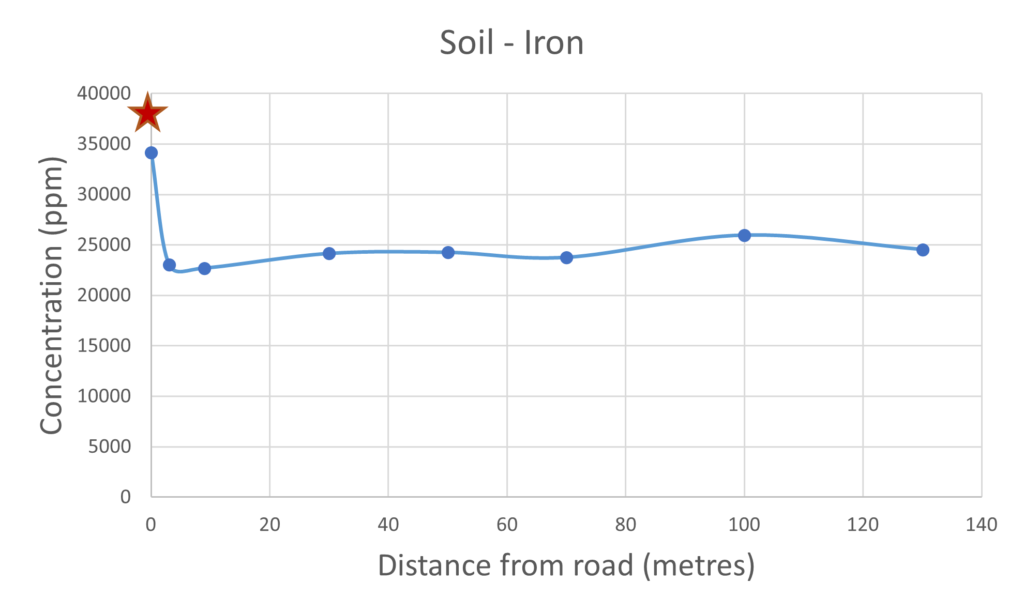
Iron is an ubiquitous element present in high concentrations in many locations on the earth’s surface and is an essential element of life. There was not a clear cut relationship between the concentration of the iron measured in the mushrooms collected closer to the road when compared to mushrooms collected further away. This would suggest that the uptake of iron expressed in the mushrooms was not effected by their proximity to the road. It was noted that the concentration of iron within the soil sampled close to the busy road was significantly higher, this would be expected due to the build up of rust from road vehicles. When comparing the soil and the mushroom results for iron there does not appear to be such a pronounced correlation. The iron results contrast significantly with the platinium and palladium results suggesting that perhaps the uptake of these metals may be less selective with respect to the iron.
Figure 4 – Iron present in mushrooms & soil
It is worth noting that the mushrooms analysed during this study were not washed prior to them being dried and prepared for ICP-MS. This leaves the question unanswered as to if the exact source of the metal contaminants measured, had been adsorbed onto the surface or were present inside the mushroom’s fruiting body. Additional work is required in order to determine which part of the mushroom contained the highest concentration of the metal contaminants, skin, flesh on the top or flesh in the stalk.
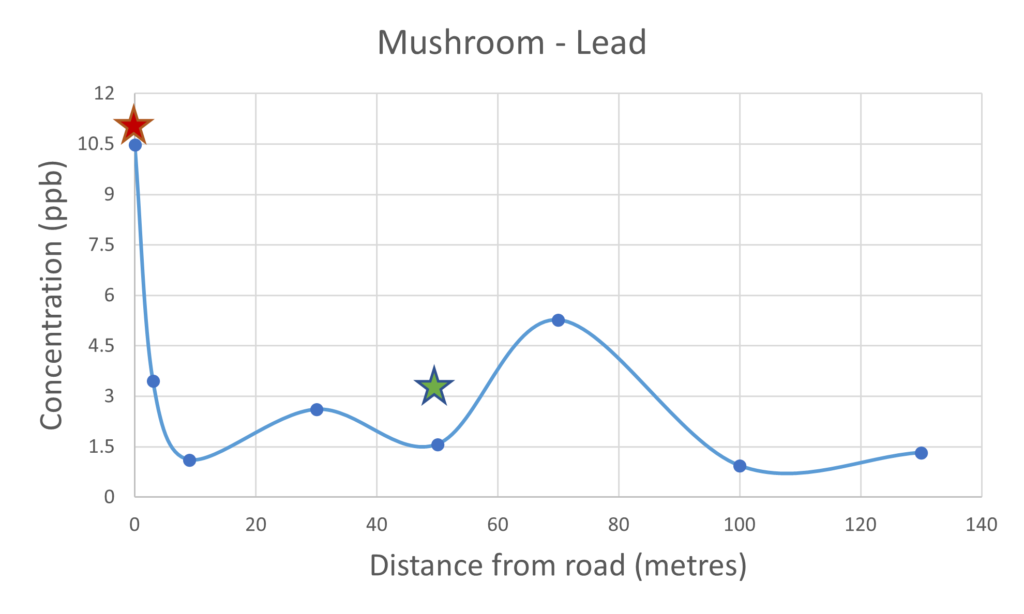
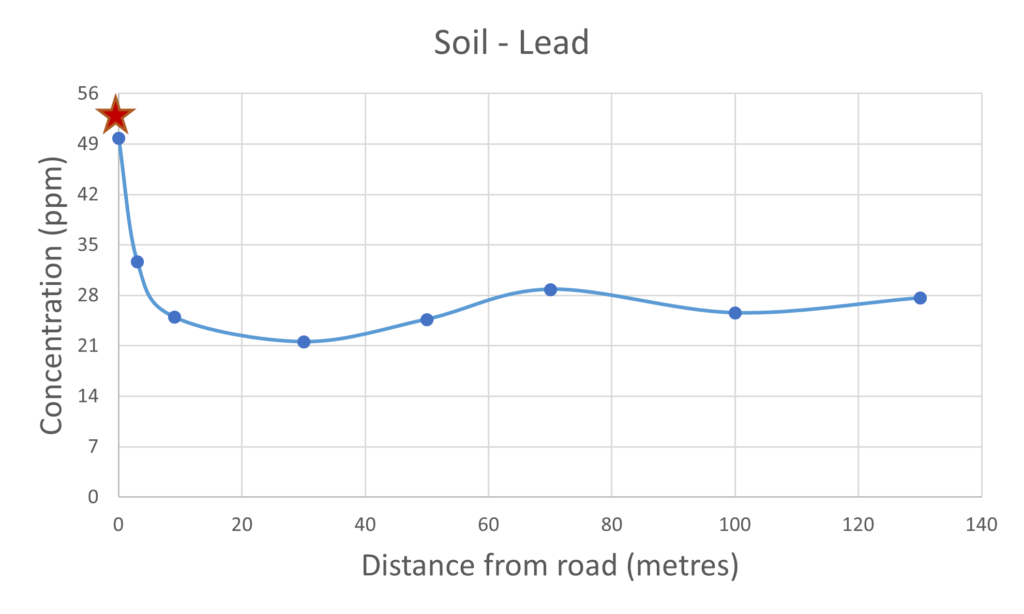
Figure 5 – lead present in mushrooms & soil
The use of lead compounds as an additive to petrol fuel has been common place since the 1920’s due to the increase in engine performance. In the UK alone it is estimated that 140,000 tonnes of lead was released into the atmosphere from the 1970’s until its use was finally banned in 1999. The lead pollution still lingers and this was observed with a high concentration in the soil of 50 ppm next to the road. The lead concentration in the soil does decrease as a function of distance from the road with a slight elevation in concentration at the 70 metre distance. That increase in the lead concentration in the soil at 70 metres is also reflected in the mushroom sample collected from the same spot which would suggest there is a significant link between the concentration of the lead present within the mushroom and that of the substrate or soil on which it grew. That trend was not observed with the iron concentrations, the concentration within the soil did not directly correlate with that of the concentration observed within the mushroom, this could be indicative of selective uptake. As the use of lead in fuel is banned the concentration of lead in the air should be relatively low which again is evidence that the lead present in the mushrooms much have been taken up from the soil substrate.
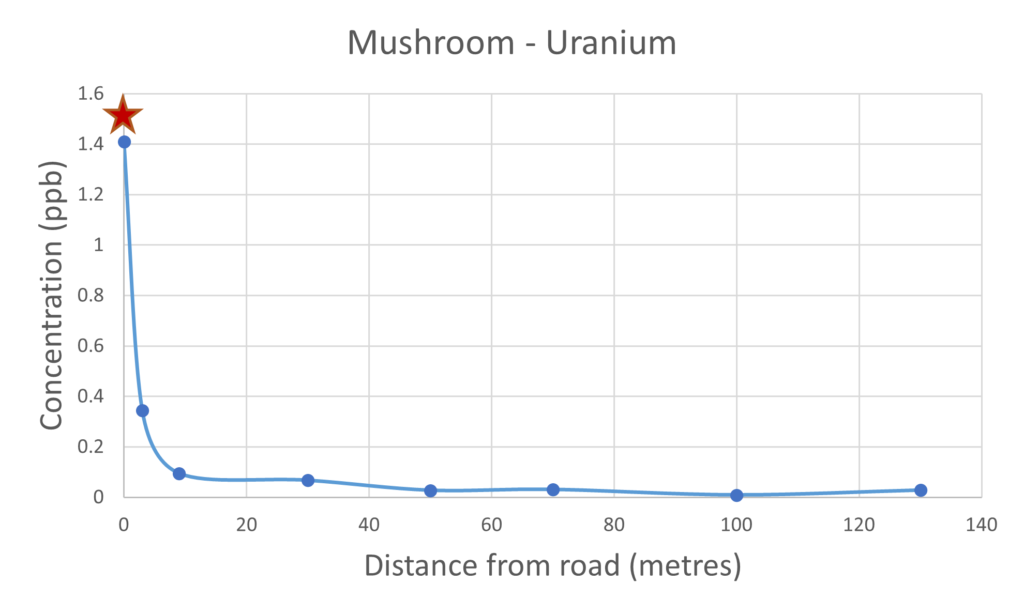
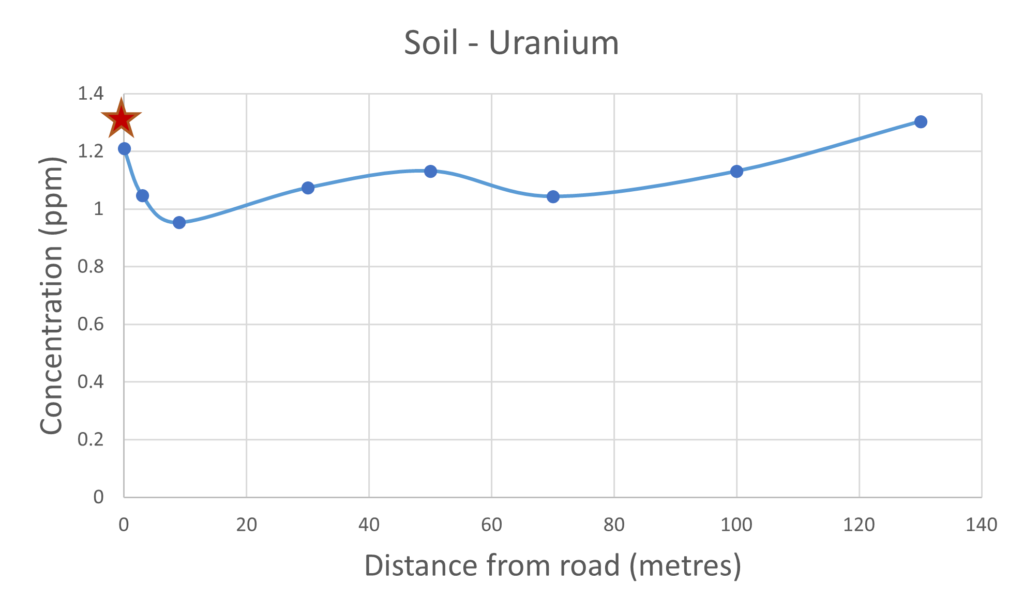
Figure 6 – uranium present in mushrooms & soil
Uranium is a very toxic heavy metal and is found naturally, it has been reported in the past that significant quantities of uranium have been measured in the Hereford area by the Hereford Time, the radioactive decay product is radon gas which can pose health risks. The results we present in this article clearly demonstrate that a higher concentration of uranium was measured in the mushroom samples collected next to the busy road. It is unclear why the levels of uranium are significantly higher closer to the road, this does require further investigation with additional samples taken at different locations.
Conclusions
The mushrooms that were foraged as far as their heavy metal content was concerned did not pose a health risk with excessively high concentrations. It could therefore be concluded that they were safe to eat, however, from the concentration plots for most elements under investigation there is a clear drop off in the concentrations of the heavy metals measured as a function of distance picked from the road.
As with any food that is foraged, it is always advisable to wash it prior to consumption.
There is plenty of scope for additional studies to be carried out as mentioned in the discussion, a repeat of the experiment with additional sampling points would be very useful. It would also be interesting to wash a sample set of mushrooms prior to analysis to determine if the contaminants were only present on the skin, the water used to wash the mushroom samples could also be analysed.
Elemental analysis by definition covers the whole periodic table and includes both qualitative and quantitative analysis of samples covering a wide range of concentrations. Organic elemental analysis may also be determined for a range of small or large molecule applications. It is possible to analyse a multi-component mixture of compounds using chromatographic techniques. If the mass spectrum of the separated components is determined accurately with high mass resolving power then each compound’s molecular formula may be deduced by software. Inductively coupled plasma mass spectrometry (ICP-MS) or x-ray fluorescence (XRF) instrumentation for the analysis of heavy metals are now ubiquitous in the modern analytical laboratory but what methods were available to chemists several hundred years ago for the determination of elemental composition let alone isotope analysis without a mass spectrometer, was it even possible?
The Early Years
The combustion of a sample to change the colour of a flame must have unwittingly been the oldest method employed for elemental analysis, very little in the way of sample preparation is required. Although not officially recorded Early man must have made these observations since dawn of time when having a fire and inadvertently burning various rocks containing interesting ores. Greek philosophers back in the 3rd century BC proposed that all mater consisted of four elements in nature – earth, water, air and fire. The occupation of Egypt by the Arabs in the 7th century resulted in the first use of the word alchemy in Eurpoe through the combination of ‘al’ from Arabic with ‘Khemia’ the Greek word for Egypt. It was proposed by the Arabian alchemists in the 8th century that all metals were made up of various proportions of mercury and sulfur with gold being the perfect metal. The transmutation of base metals into gold was apparently facilitated by the use of substance known as the pholosphor’s stone. It was not until 1901 Rutherford and Soddy discovered that radioactive thorium was transmutating into radium however Rutherford was apparently not so keen on using the same language as the alchemists.
In 1556 a German metallurgist named Georgius Agricola published the first paper and noted that different ores when placed into a flame changed “the colour of fumes” this information was used for qualitative analysis. In the early 1700s Newton investigated light and developed the prism as a means of separating light into its constituent colour or wavelengths. Another century passed before the prism was used to observe and characterise the spectral lines emitted from the elements present in the sun, Foucault noticed that the sodium lines were present in both the sun and a flame. The collaboration between Bunsen and Kirchhoff who are credited with founding the field of analytical chemistry accelerated the development of a flame excitation instrument by combining the hot Bunsen burner flame with Kirchhoff’s spectroscope. Sample introduction was simple and involved placing small quantities of a solid sample directly into the flame usually on a wire loop. Excited atoms or ions generated in a hot flame emit characteristic photons or coloured light during the radiative de-excitation process. The spectroscope was used to record the wavelengths of the emission lines that were characteristic of the element under investigation, and so optical emission spectroscopy was born. For quantitation purposes it is necessary to measure and record the intensity of the emission for each calibration standard prior to running the unknown sample, this however proved difficult with the technology available at that time. The fundamental research was critical for qualitative analysis but it was a number of years before these prototype instruments matured into a product available on the elemental analysis market for quantitation.
The Flame Photometer
The first invention of an instrument resembling a flame photometer was developed by Champion, Pellet and Grenier in 1873. The instrument consisted of two flames one for the analysis of the unknown sample the other for a calibration standard of known concentration, the operator would view displaced emission spectra from each flame through a spectroscope for a single element sodium. Visual photometry was used to compare the intensity of the emission from the unknown sample with that of the emission from the calibration standard, the concentration of sodium was determined using this method to within 5 %. Their instrument design was later improved by Gouy in 1877, who demonstrated that the intensity of the emission was proportional to the size or temperature of the flame and the amount of sample present. In order to account for this Gouy developed the first pneumatically assisted atomizer for liquid sample introduction, an early ancestor of the modern nebuliser and spray chamber sample introduction techniques, this ensured that the amount of sample entering the flame was controlled therefore improving the accuracy of the analysis. Lundegardh during the 1920s, made further improvements to the sample introduction atomiser for flame photometry instrumentation and also incorporated a photographic plate for recording the results.
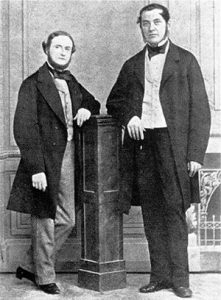
Gustav Kirchhoff (left) and Robert Bunsen (right)
Atomic Absorption Spectroscopy
Atomic absorption spectroscopy (AAS) was also developed by Kirchhoff using his spectroscope, he observed that when a bright light was shone through a flame that contained excited atoms of an element, characteristic wavelengths associated with electronic transitions of the element were absorbed leaving dark bands confirming its presence. Kirchoff published “the relation between the powers of emission and the powers of absorption for rays of the same wavelength is constant for all bodies at the same temperature.”
Limitations of the instrumentation required to accurately monitor and record the absorption or emission of light hindered the development of the above spectroscopic techniques for quantitative analysis. The integration of photographic plates by Lundegardh did improve the accuracy and precision but calibration was difficult for absolute quantitation. Spectral interference and a lack of sensitivity of these techniques for certain analytes made them impractical for certain trace analysis applications. The main techniques employed in practice up until the early 20th century and indeed today in some cases for elemental analysis use either gravimetric or titrimetric methods of analysis. What was really needed was the development of a reliable electronic detector for recording the instrument response, once this was achieved a calibration curve could be plotted using external standards.
Following on from Gouy’s initial observations related to the size of the flame and intensity of emission it was later concluded that this relationship was due to an increase in the population of the excited state of the analyte in the flame as a function of temperature. Over the next decade various flames were used including hydrogen in air, acetylene in air and acetylene in nitrous oxide, each of these mixtures produced a hotter flame with an associated increase in detection limit. Flame atomic absorption spectroscopy (FAAS) instruments were developed during the 1950s, for the analysis of aqueous samples, the addition of nitrous oxide acetylene flames improved the sensitivity for certain analytes in challenging environmental samples. The most sensitive AAS instruments available on the market today employ graphite furnaces that can detect an analyte concentration with a detection limit of down to ppb for some assays. Sample preparation often involves microwave digestion of a solid sample in nitric acid, biological samples may also be prepared using a similar method prior to sample introduction at a suitable concentration.
Atomic Emission Spectroscopy
The development of atomic emission spectroscopy did not receive much attention for a number of years due to a lower detection limit being achieved using atomic absorption techniques. A stable plasma source running at more than twice the temperature of the hottest flame was required to realise the full potential of atomic emission spectroscopy. In 1974, the first commercial inductively coupled plasma optical emission spectroscopy (ICP-OES) instruments were developed using argon gas by KONTRON in Germany. The use of inductively coupled argon plasma instrumentation for emission spectroscopy is very popular today and offers a lower detection limit than atomic absorption for elemental analysis especially for the analysis of toxic metals.
Discovery of the Neutron
The only caveat with both of the above aforementioned spectroscopic analysis techniques is their inherent lack of isotopic selectivity. Rutherford and Soddy first proposed the idea of transmutation of the elements back in 1902, that lead to a significant modification to Dalton’s atomic theory however the term or idea of an isotopes was not considered. Some years later Soddy and Fajans simultaneously proposed the existence of isotopes in 1913, through the study of radioactive decay chains and the discovery of three different stable isotopes of lead.
Mass Spectrometry and Isotope Ratio Analysis
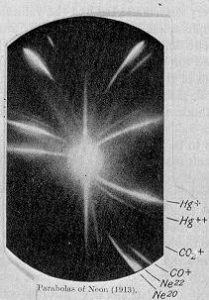
Mass spectrometry changed everything for isotope analysis. Thompson and Aston analysed a neon gas sample using a parabola mass spectrograph developed in 1912 at the Cavendish laboratory in the University of Cambridge. Two parabolas or traces were observed when they had both expected only one for the pure sample of neon.
In the bottom right corner of J. J. Thomson’s photographic plate are the separate impact parabola marks for the two isotopes of neon: neon-20 and neon-22.
Thompson had initially thought they had discovered a new element but Aston was not convinced. After learning about Soddy’s discovery and proposed existence of isotopes Aston spent a fellowship distilling liquid air and performing what are now known as isotope enrichment experiments on neon. Neon samples were diffused through porous clay, some enrichment was achieved and measured using a quartz microbalance. Once further developments and improvements by Aston of the mass spectrometry instrumentation came to fruition other isotopes were discovered and the field of isotope ratio mass spectrometry (IRMS) was established. Previous assays using gravimetric analysis for the determination of the (average) atomic mass of the elements on the periodic table were cross validated with results acquired using isotope ratio mass spectrometry with remarkable accuracy. The consequence of the early work carried out by Thompson and Aston was the realisation that the chemical properties of an element are determined by its atomic number rather than its atomic weight. The existence of isotopes was also published independently by Mosley in 1913, who demonstrated the relationship between an element (atomic number) and the wavelength of the corresponding x-ray spectral lines.
Other Methods for Separation of Isotopes
Isotope ratio analysis has really only become a mainstream analytical technique for a variety of sample type due to the use of electromagnetic separation employed by mass spectrometry. The chemical separation of isotopes is difficult because their chemistry is almost identical. Lighter isotopes do tend to react or evaporate more quickly allowing them to be separated however the efficiency is low. Diffusion rates of different isotopes of a gas or liquid across a membrane will be different due to the lighter isotopes traveling more quickly, this method was used by Soddy for his enrichment experiments however the timeframe is such that it is impractical for use as a quick analytical method. Centrifugal separation of isotopes is common for the enrichment of the heavier isotopes containing uranium, the technique was first proposed by Aston and Lindemann back in 1919, again this technique is more suited for large scale preparative applications rather than analysis. Lasers may be used for the analytical separation and detection of a single isotope from a mixture when finely tuned to resonantly excite a hyperfine interaction between an electron and the nucleus, each isotope will have different hyperfine spectra due to the difference in atomic weight of their respective nuclei. Colinear resonance laser spectroscopy (CRIS) when combined with mass spectrometry offers the highest level of sensitivity and selectivity for sub ppq level elemental analysis.
Development of ICP-MS Instrumentation
The realisation that mass spectrometry could be used to determine the mass-to-charge ratio of ions that are generated from an inductively coupled plasma was a huge step change in the development of ultra-trace elemental analysis instrumentation. When compared with ICP-OES analysis the sampling of the ion beam rather than the emitted light offers many advantages, the lack of spectral interference is critical for the analysis of elemental impurities at very low detection limit. The main technological breakthrough came with the development of an atmospheric pressure inlet for a mass spectrometer that could sample the ion beam generated by an argon plasma ion source for subsequent mass analysis.
Sample Preparation and Analysis by ICP-MS
Sample preparation for ICP-MS is the same as the other spectroscopic techniques, aqueous samples are usually prepared in dilute nitric acid. Solid samples may require dissolution in stronger acids such as aqua regia or even hydrofluoric, microwave digestion is also used to speed up the process. Sample introduction involves the nebulisation of the liquid sample into the spray chamber with argon gas. The analysis of a solid sample is also possible with minimal sample preparation using laser ablation, the ablation plume is swept into the argon plasma using a stream of argon gas. Once inside the ICP torch ionization of the sample occurs in the argon plasma to generate the ion beam. The analyte ion will then be selected by the mass analyzer for transmission through to the detector. The most common mass analyzer used in ICP-MS is the quadrupole for both ultra-trace and trace element analysis covering an elemental concentration range of up to 10-orders of magnitude. ICP-MS instrumentation using a single quadrupole mass spectrometer does however suffer from isobaric interference which can mask the analyte ion as a matrix effect. The argon plasma will generate a series of polyatomic interference ions; for example the argon in the plasma will react with oxygen to give argon oxide at m/z 56 which represents a major isobaric interference with the most abundant isotope of iron at the same mass. Chlorine present in a liquid sample can also form an argon chloride polyatomic ion for each of the major chlorine isotopes that constitute a major isobaric interference for the analysis of arsenic. Various methods that have been employed to reduce polyatomic interference from the ion beam the most successful being the use of a collision cell before the quadrupole mass analyzer. The collision cell will fragment the polyatomic interference effectively changing its mass and therefore only let the analyte ion pass through the mass analyzer for detection. Unfortunately, isobaric interference may also present from an atomic ion generated from an isotope of a different element. The only way to remove these interferences is to use a different type of mass spectrometer that incorporates either a high mass resolving power mass analyzer or a tandem quadrupole mass spectrometer with an additional collision cell in between the two quadrupoles. The collision or reaction cell employed for ICP-MS-MS experiments increase the selectivity of the analysis; this is achieved by using a reaction gas that will selectively react with either the analyte or interference ion to increase its mass for subsequent separation and independent detection.
Analysis of Difficult Samples
The most sensitive routine mass spectrometry instrument for ultra trace element analysis in use today that minimise isobaric interference for challenging environmental samples uses a tandem quadrupole mass analyzer ICP-MS/MS. These instruments have a variety of sample introduction inlets available for the analysis of a liquid sample, particles or even nanoparticles in suspension is possible. The addition of an external laser sampling system for mass spectrometry imaging applications of a particular element in a solid sample using laser ablation is also becoming popular. Software now available enables isotope dilution methods to be run with ease and the use of an internal standard is now routine to improve the precision and accuracy of the results. ICP-MS is a highly versatile elemental analysis technique however it is not possible to use it for the analysis of the lighter elements such as carbon. The instrument of choice for isotope ratio analysis would be a mass spectrometer using a magnetic sector with multiple detectors one for each isotope, an inductively coupled plasma ion source or ideally a thermal ionisation mass spectrometer (TIMS) will give the most precise isotope ratio measurements.
Organic Elemental Analysis, the CHNS Elemental Analyzer
Organic compounds are amenable to ICP-MS however they would have to be digested usually by microwave in nitric acid prior to analysis. It is not possible to use an ICP-MS to get any molecular formula information or quantify the ratio of carbon present. If molecular weight information is required one needs to employ a different ionization source for mass spectrometry such as electrospray for LCMS. A simple combustion technique such as CHNS analysis is ideal to determine the ratio of carbon, hydrogen, nitrogen and sulfur in solid or liquid samples. The development of the CHNS elemental analyzer as a commercial instrument for combustion analysis started with Carlo Erba in 1968. Typically, milligram quantities of the sample are introduced into a combustion tube in excess oxygen, flash photolysis ensues followed by gas chromatography to separate and quantify the evolved combustion gas products such as carbon dioxide. CHNS analysis may be used to test product quality, food or soil analysis.
Accurate Mass LC-MS for Elemental Analysis
There are many types of mass spectrometer available today for the analysis of solids, liquids or gases. Liquid chromatography mass spectrometry (LC-MS) involves the hyphenation of a liquid chromatograph with a mass spectrometer. The MS system will usually incorporate an electrospray ionization or atmospheric pressure chemical ionization source. The sample must be soluble in the mobile phase that flows through the liquid chromatograph which is usually a polar solvent. Separation of the analyte from the sample matrix occurs in a chromatographic column due to the analyte’s polarity; the analyte will partition between the polar mobile and immobilized non-polar stationary phase (like attracts like). The stronger the affinity of the analyte to the stationary phase the longer its retention time within the column. Each component or compound separated by the liquid chromatograph will have a unique retention time for a given analytical method run by the liquid chromatograph (mobile phase solvents, flow rate and type of column). Once separated each analyte will flow into the mass spectrometer where ionization will occur, ions generated from the ion source are then separated by the mass analyzer followed by detection to generate a mass spectrum. Electrospray ionization is a soft ionization technique and tends to only yield a protonated molecule in positive ion mode or a deprotonated molecule in negative ion mode. It is possible using tandem mass spectrometry for example to fragment the precursor ion in the collision cell to yield a number of characteristic product ion fragments. The mass spectrometry method development process involves tuning the various ion optics and collision energy to generate a characteristic fragment ion that can be used for quantitation or conformation that an analyte is present in the sample. High sensitivity is one of the best features of MS detection, it is also quick and can be one of the most specific (using accurate mass) and selective analytical techniques available today. Applications include metabolite profiling for metabolomics, proteomics, environmental monitoring and drug development. Once the mass spectrum has been acquired with an accurate mass additional data processing may be used to generate the chemical formula, this in turn will give the elemental composition.
This brief review is by no means exhaustive, there are many other techniques that have played their part in the development of analytical chemistry for elemental analysis. In answer to the original question posed regarding the feasibility of elemental analysis several hundred years ago the answer is yes for certain elements using flame excitation methods, however quantitation was not possible really until the late 1870s. In order to determine the isotope ratio of an element this has only been made possible with the advent of mass spectrometery within the last 100 years. The necessity to push detection limits for the analysis of complex samples has never been in such demand as it is today especially for the detection of radionuclides in difficult environmental samples. The new analytical techniques under development by Artemis Analytical Ltd combine the very best that laser spectroscopy and mass spectrometry have to offer meeting the challenges of tomorrow head on regardless of the complexity of the sample type.
This website uses cookies so that we can provide you with the best user experience possible. Cookie information is stored in your browser and performs functions such as recognising you when you return to our website and helping our team to understand which sections of the website you find most interesting and useful.
Strictly Necessary Cookies
Strictly Necessary Cookie should be enabled at all times so that we can save your preferences for cookie settings.
Cookies:
PHPSESSID – Preserves user session state across page requests.
This website uses Google Analytics to collect anonymous information such as the number of visitors to the site, and the most popular pages.
Keeping this cookie enabled helps us to improve our website.
_ga – Registers a uniq e ID th at is used to generate statistical data on how the visitor uses the website
_gat – Used by Google Analytics to throttle request rate
_gid – Registers a uniq e ID th at is used to generate statistical data on how the visitor uses the website
collect – Used to send data to Google Analytics about the visitor’s device and behaviour. Tracks the visitor across devices and marketing channels.
NID – Registers a unique ID that identifies a returning user’s device. The ID is used for targeted ads
If you disable this cookie, we will not be able to save your preferences. This means that every time you visit this website you will need to enable or disable cookies again.